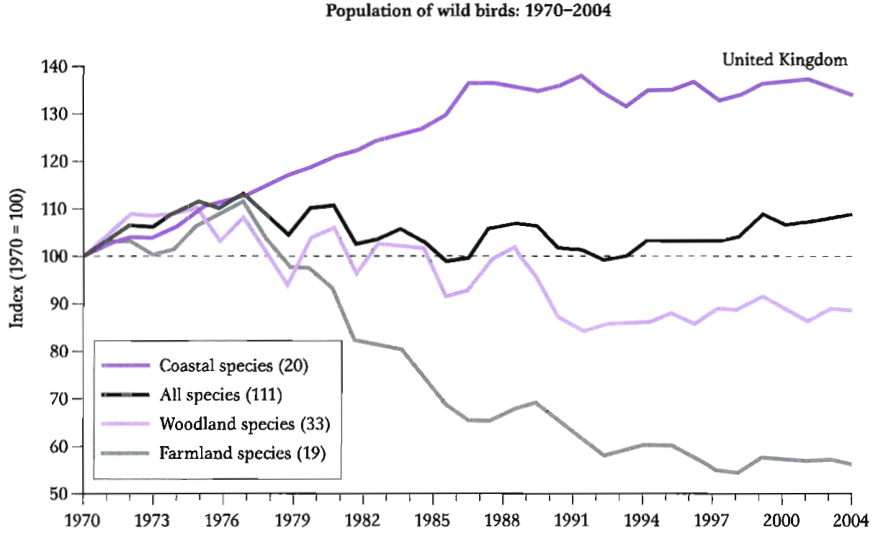
The graph below shows the population figures of different types of wild birds in the United Kingdom between 1970 and 2004.
Summarise the information by selecting and reporting the main features, and make comparisons where relevant. Write at least 150 words.
This response will be reviewed and graded after submission.
Grading can be reviewed and adjusted.
Grading can be reviewed and adjusted.
Hint
Model answer
The toral number of all species of wild birds in the UK has been relatively stable over the last two decades, although there were significant drops in numbers between 1977 and 1979 and again in 1982 and 1986. Since 1994 there has been an improvement in numbers of all species, although the graph shows a slight decrease in 2000.
In contrast, the population of farmland birds has suffered a severe decline, particularly in 1978 when numbers fell dramatically. The rate of decline in the population appears to have slowed and it has remained relatively stable since 2000.
There was also a fall in the number of woodland birds of around 30% between 1974 and 1992. The population increased slightly in 2000 but it had dropped again by 2004.
It is only coastal species that have seen a steady increase in population over this period. Their numbers dropped slightly in 1995 and again in 2003 but the overall trend has been a positive one.